GKG Analysis to Identify Influential Individuals
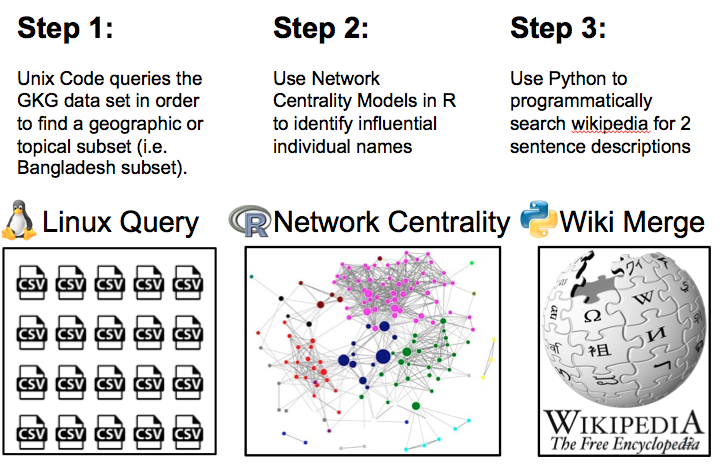
The Global Knowledge Graph, related to the Global Database of Events, Language, and Tone, provides a very rich dataset with many potential use cases. In this blog I will illustrate how we used it to identify influencers in a national or regional network. This algorithm feeds a Shiny WebApp located here. The basic idea of this algorithm is to subset 30 days of GKG data based on regions (we found that national capitals worked best), build a network of the people in this subset (based on co-mentions), and then to run network centrality algorithms against this network to order the data based on influence. The top influencers on this list are then fused with Wikipedia data in order to provide a two sentence description.
This process is illustrated below:
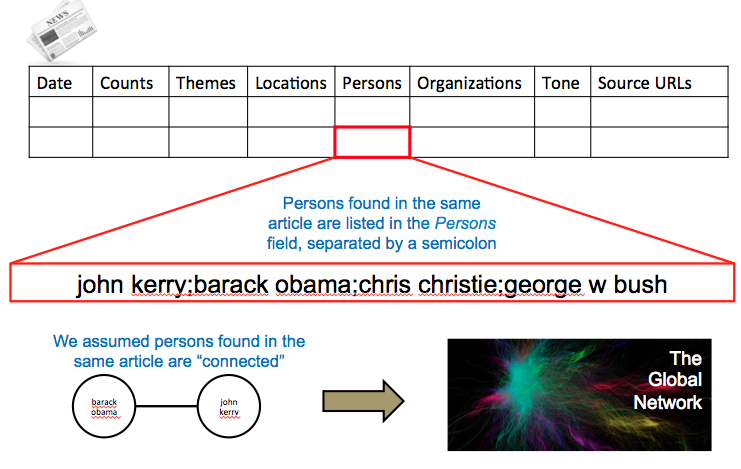
The image below illustrates how we use co-mentions in the GKG data to build a network.
The algorithm is provided below:
library(rPython) # sudo aptitude install python-dev
library(igraph)
# list of areas of interest that we will analyze
location <- c("dhaka","estonia","astana","paraguay","baghdad",
"mosul","yemen","somalia","kinshasa","abuja","aleppo",
"monrovia","district of columbia","bamako","kiev")
# Look through each location, build location network, analyze network centrality, and save results
for (j in 1:length(location)){
setwd("/home/beskow/gkg/csv/")
#Use UNIX code to subset data, creating geographic subset in single CSV File
system(paste("grep -i '",location[j],"' /home/beskow/gkg/csv/*.csv >
/home/beskow/gkg/results/",gsub(" ","",location[j]),"GKG.csv",sep=""))
##Read geographic subset into R
output <- read.csv(paste("/home/beskow/gkg/results/",gsub(" ","",location[j]),
"GKG.csv",sep=""),header=FALSE,sep="\t",quote="",dec=".",fill=TRUE,as.is=TRUE)
##Change Column Names
names(output) <- c("DATE","NUMARTS","COUNTS","THEMES","LOCATIONS","PERSONS",
"ORGANIZATIONS","TONE","CAMEOEVENTIDS","SOURCES","SOURCEURLS")
##If number of rows exceed 75000, boot-strap with different algorithm
if (nrow(output) > 75000) {
source('/home/beskow/SampleGraterThan.R')
break
}
articles <- output$PERSONS ##Set articles to PERSONS vector
rm(output) ##clear output from memory
articles <- as.list(articles) ##Create list
#Split names by semi-colon, store are vector in list
articles <- lapply(articles, function(x) unlist(strsplit(x,";",fixed=TRUE)))
##Make sure there aren't duplicate names in any article
articles <- lapply(articles, unique)
##The code below removes any article that doesn't have any PERSONS listed
z <- lapply(articles,function(x) length(x))
z <- unlist(z)
articles <- articles[z!=0]
##Create a function that duplicates names that appear by themselves in an article
##this function is used below in order to create a self-loop
myDuplicate <- function(x){c(x,x)}
z <- lapply(articles,function(x) length(x))
z <- unlist(z)
for(i in 1:length(z)){
if(z[i]<2) articles[[i]]<-myDuplicate(articles[[i]])
}
##Create the edge list for each article
articles <- lapply(articles, function(x) t(combn(x, 2)))
# glue all of the indivdiual edgelists together into a big edgelist
# entries should repeat here, if the same pairing is mentioned in more than one article
elist <- do.call(rbind,articles)
# dump the edgelist into igraph
adj <- graph.edgelist(elist, directed=FALSE)
##Save network as an RData File
save(list="adj",file=paste("/home/beskow/gkg/results/",
gsub(" ","",location[j]),".RData",sep=""))
eig <- evcent(adj) #Calculate eigenvector centrality
degree <- degree(adj) #Calculate degree centrality
elist <- elist[!duplicated(elist),]
adj <- graph.edgelist(elist, directed=FALSE) # dump the edgelist into igraph
close <- closeness(adj) #Calculate closeness centrality
between <- betweenness(adj) #Calculate betweenness centrality
##Build final data frame and combine centrality measures
finalData <- data.frame(Name=names(close),close=close,degree=degree,
between=between,eigenvalue=eig$vector)
finalData <- finalData[order(finalData$eigenvalue,decreasing=TRUE),]
finalData <- finalData[1:100,]
finalData$Description <- NA
##Use Python Wikipedia Package to scrape Wikipedia for 2-sentence descriptions
for(m in 1:100){
python.exec("import wikipedia")
Command <- paste("a=wikipedia.summary('",finalData$Name[m],
"',sentences=2)",sep="")
try(python.exec(Command))
try(finalData$Description[m] <- python.get("a"))
if(m > 1){
if(finalData$Description[m] == finalData$Description[m-1]){
finalData$Description[m] <- "Either Wikipedia Data is Not Available for this Name or Multiple Wikipedia Answers are Available"
}
}
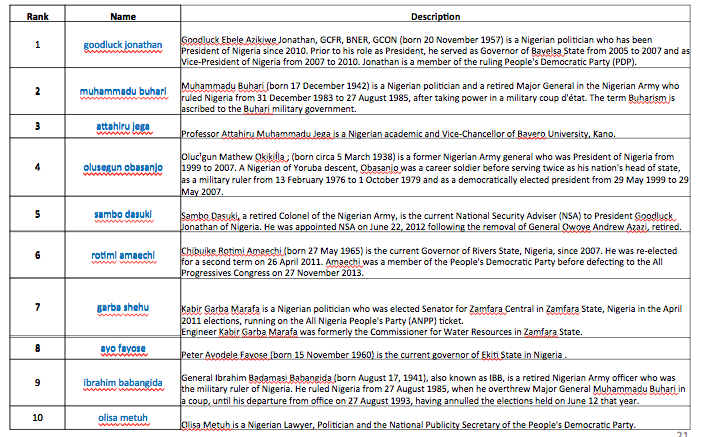
}After running the code, the ordered list of influential people looks like the list below (this result if from Abuja, Nigeria in early 2015).